See this blog post for my take on university pass rates and what we can learn from a deeper dive into the data.
The ARE Series - Show Me the Data
We have pass rate percentages by division overall and by university. However no aggregate data. At most you know whether your selected school is above or below the average. We can do better than that. Some terminology and background information before we begin analyzing the data. I looked at two sets of metrics.
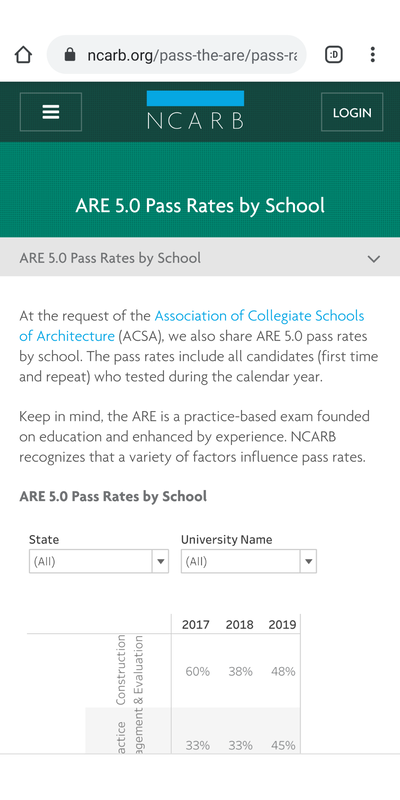
The following was curated from data found in the ARE 5.0 Pass Rates by School website.
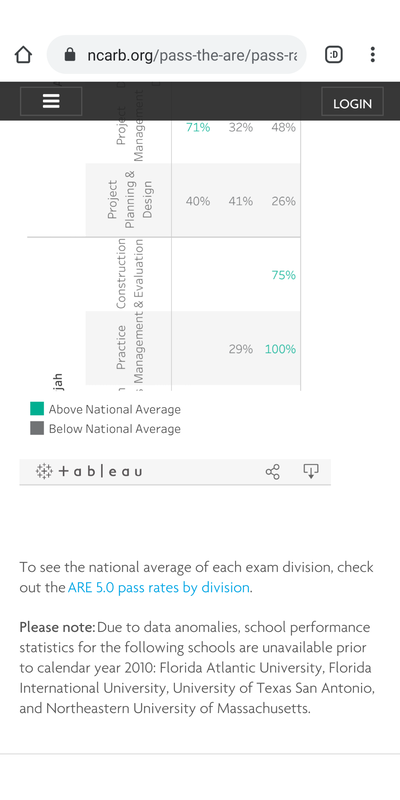
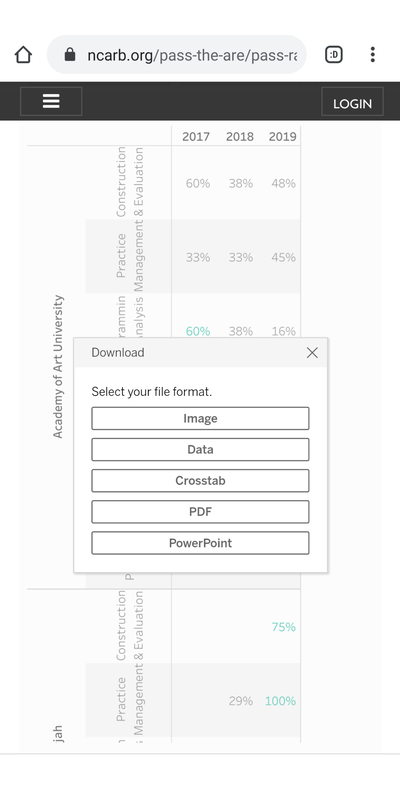
The following are the steps I followed to download the data. I encourage others to download this information and analyze it as well. I believe we can learn so much from this data.
The following are the steps I followed to download the data. I encourage others to download this information and analyze it as well. I believe we can learn so much from this data.
ARE PASS RATES BY SCHOOL DASHBOARDS
I looked at two sets of metrics.
First is the demographic make-up of the universities:
Second, I looked at whether the architecture program is ranked:
For each set of analysis I looked at the data in two ways:
Note: Head over to my Tableau page for these visualizations where you can interact with each page separately and download the source information. Full transparency.
First is the demographic make-up of the universities:
- HBCU
- Historically Black College or University
- MSI
- Minority Serving Institution — Technically HBCUs are just one category of MSIs but for the purposes of this dashboard I have separated out HBCUs and am using MSIs to refer to the remaining Minority Serving Institutions. This includes Hispanic-Serving Institutions (HSIs), Tribal Colleges and Universities (TCUs) and Asian American and Pacific Islander Serving Institutions (AAPISIs)
- PWI
- Predominantly White Institution — The majority of universities
Second, I looked at whether the architecture program is ranked:
- DI40
- Design Intelligence ranking of the Top 40 Architecture Schools. They have changed their wording recently to Most Admired Architecture Schools.
- DI40 / Ivy League
- Unsurprisingly all the Ivy League programs are also ranked, but it’s interesting to compare the Ivy’s to the rest of the ranked programs.
For each set of analysis I looked at the data in two ways:
- Percentages — Compare pass rate percentages
- Counts — Compare number of attempts
Note: Head over to my Tableau page for these visualizations where you can interact with each page separately and download the source information. Full transparency.
**Quick Tip! Select the FULL SCREEN button for a better experience!!**
Overall Pass Rates & Counts
Pass Rate Percentages by Division
Counts of Exam Division Attempts
Pass Rates & Counts by University
Note: Head over to my Tableau page for these visualizations where you can interact with each page separately and download the source information. Full transparency.


